Hello — and thank you for spending these few minutes with us.
Every federal election, about one in three registered young Black and Hispanic men, 18 to 32, doesn't cast a ballot. In midterms it's closer to one in two. They registered. They just didn't finish.
This is Ballot Bridge — a participation-equity initiative built on Census voter data, the McDonald Voting Eligible Population estimates at the University of Florida, and state policy records from the National Conference of State Legislatures. Sources elections officials, academic researchers, and civic organizations work from independently.
One disclosure up front: the Census survey self-reports turnout a few points high. Every number you'll hear carries that caveat.
Seven findings. About nine minutes. Let's begin.
How this works. Click any ▶ Listen button to start the audio. The deck auto-plays straight through, scrolling smoothly to the next scene about two seconds after each one ends. Click the same Listen button again to pause; click once more to resume. Click any chart to enlarge it — the audio keeps playing, and the deck waits to advance until you close the chart.
Ballot Bridge · who isn't voting — and why
It was never about all young people.
It comes down to a specific group the system keeps losing at the very last step — registered, ready, and never counted.
1 in 3
registered young Black and Hispanic men, 18–32, doesn't cast a ballot — every federal general election
~1 in 2
jumps to nearly this in midterms — when young men of color vanish first
And here's the part that matters: twenty years of organizing already got young Black and Hispanic voters onto the rolls. The movement just never built what helps them finish — the second mile from registered to counted. This is the story of that gap, by group, and exactly what closes it.
For twenty-five years, the mainstream youth-voter story has been about all young people. Apathy. Distraction. A generation tuning out. The organizations closest to the work — the Divine Nine, the NAACP, Black Voters Matter Fund, Mi Familia Vota, When We All Vote — have been telling a different story for just as long. The data backs them up. Every federal general election, about one in three registered young Black and Hispanic men, eighteen to thirty-two, doesn't cast a ballot — and in midterms it's nearly one in two. These are men who registered. For this cohort, the registration work has largely landed. What's missing is the part that helps them finish.
The problem · Finding 1
Thirteen elections in a row, the same gap.
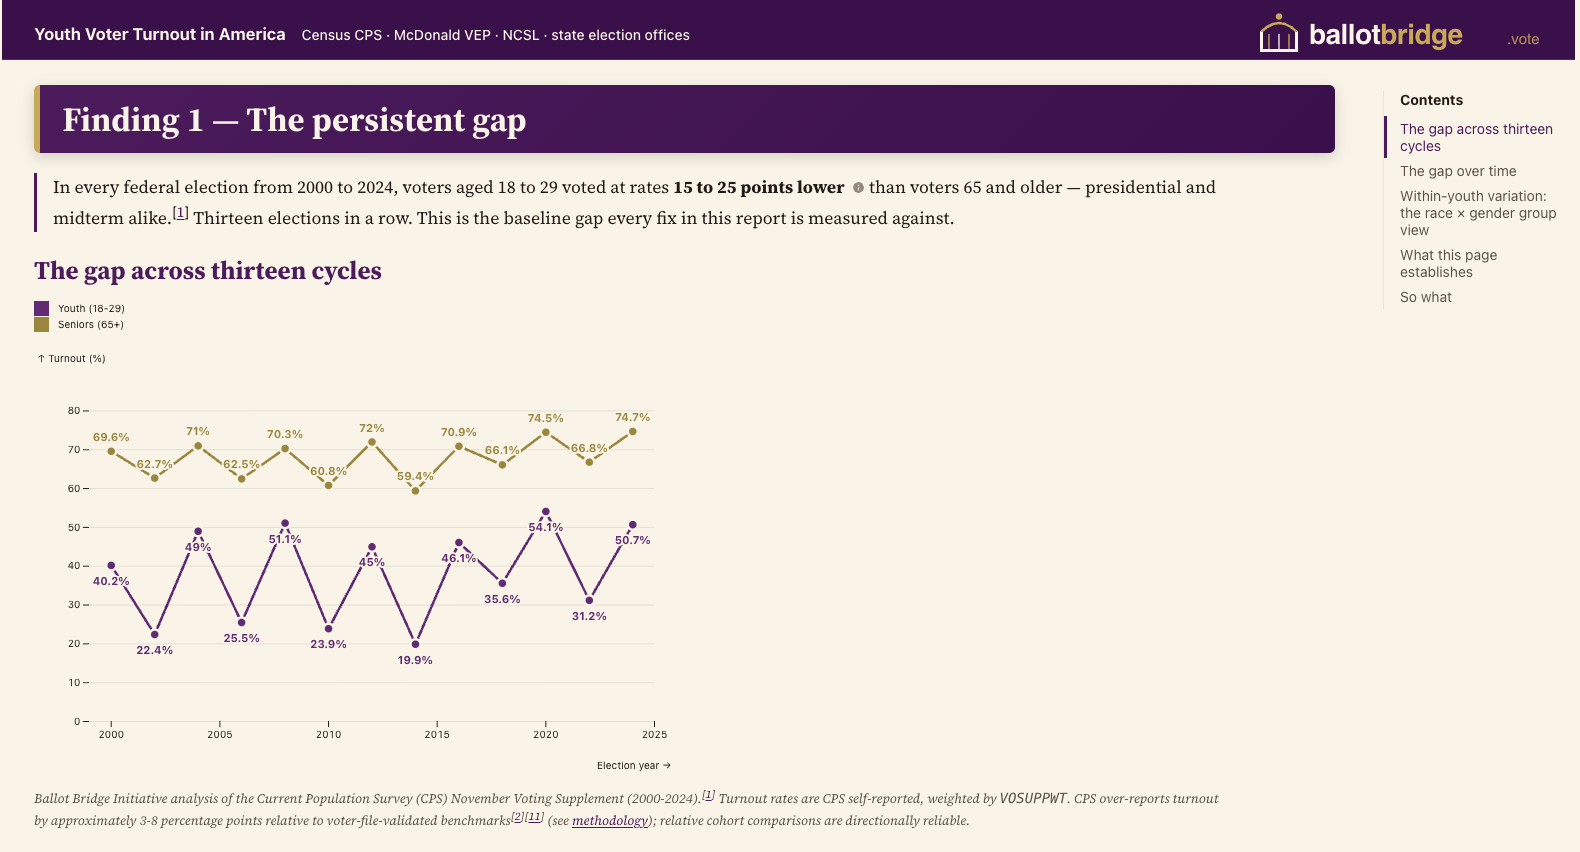
Start with the backdrop. Every federal election since 2000, voters 18–29 have turned out roughly 24 to 37 points below voters 65+. Not one cycle — thirteen. It's structural — it lives in the system, not the headlines. But it isn't evenly spread: trace it to its source and it concentrates in the young Black and Hispanic men we just named.
0
consecutive federal cycles with the gap (2000–2024)
0
widest youth-vs-senior turnout gap
Youth (18–29) vs senior (65+) turnout, every federal election 2000–2024.
For a quarter-century, young people have voted far less than older people — and not because of one bad year or one disappointing candidate. Thirteen federal elections in a row, the same gap shows up. That tells you it's built into how the system works, not into how young people feel. And it isn't spread evenly: follow the gap down to its source, and it sits squarely with young Black and Hispanic men.
The highlight · Finding 2 · the midterm amplifier
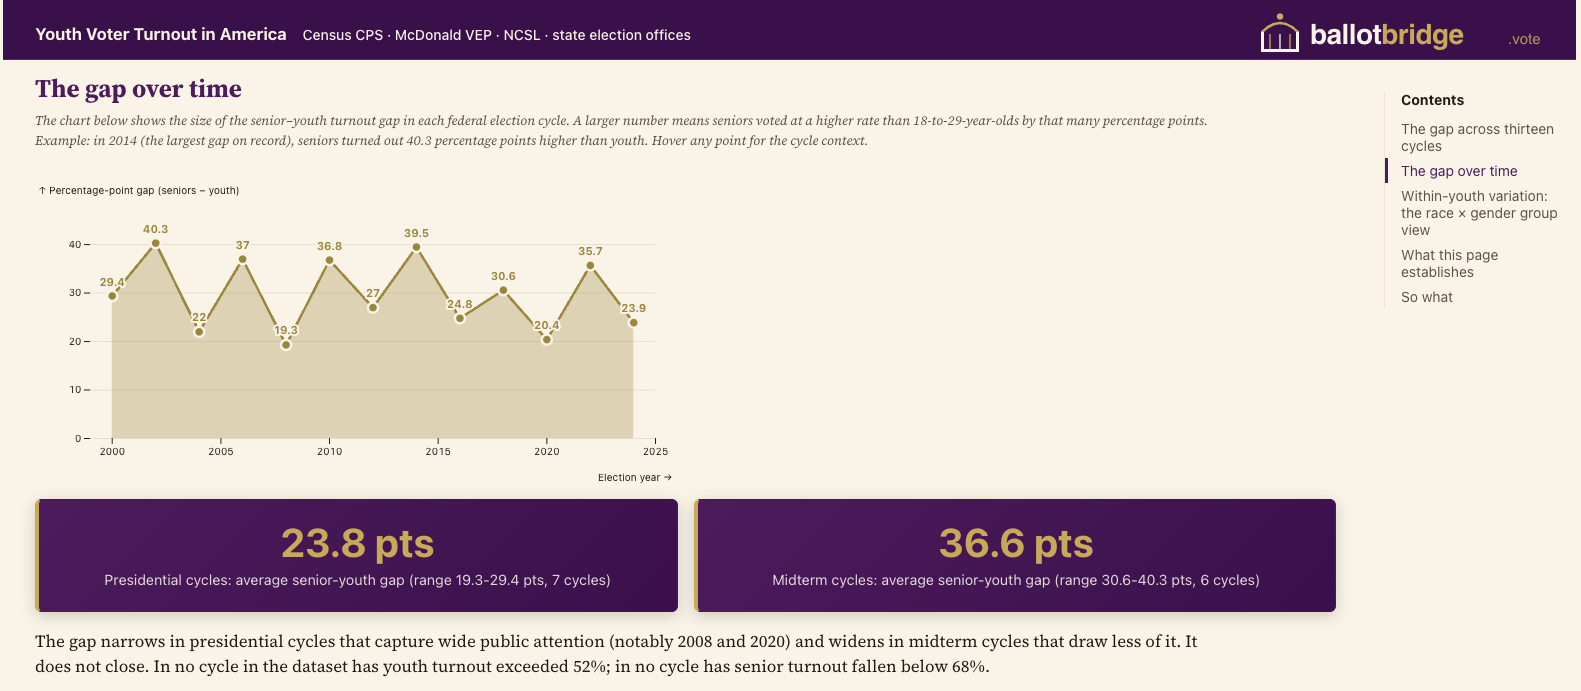
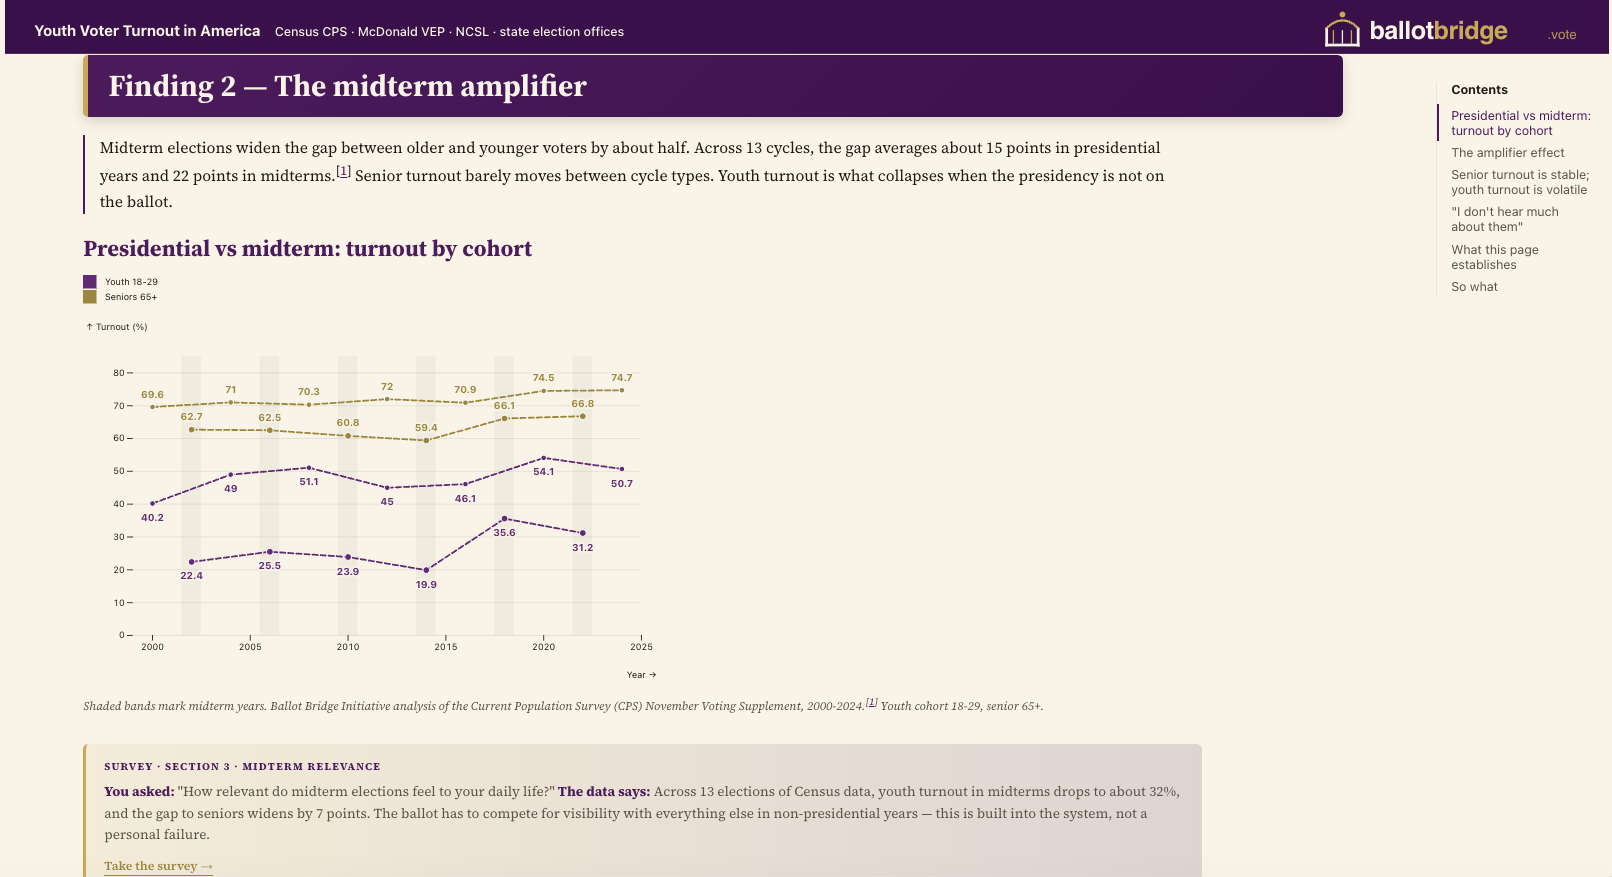
Midterms don't shrink the gap. They double it.
And the reason rewrites the story: seniors barely move between cycle types. It's young people who disappear when the presidency isn't on the ballot — and the men the system already loses are the ones who vanish first. A mobilization failure, not a senior surge.
0
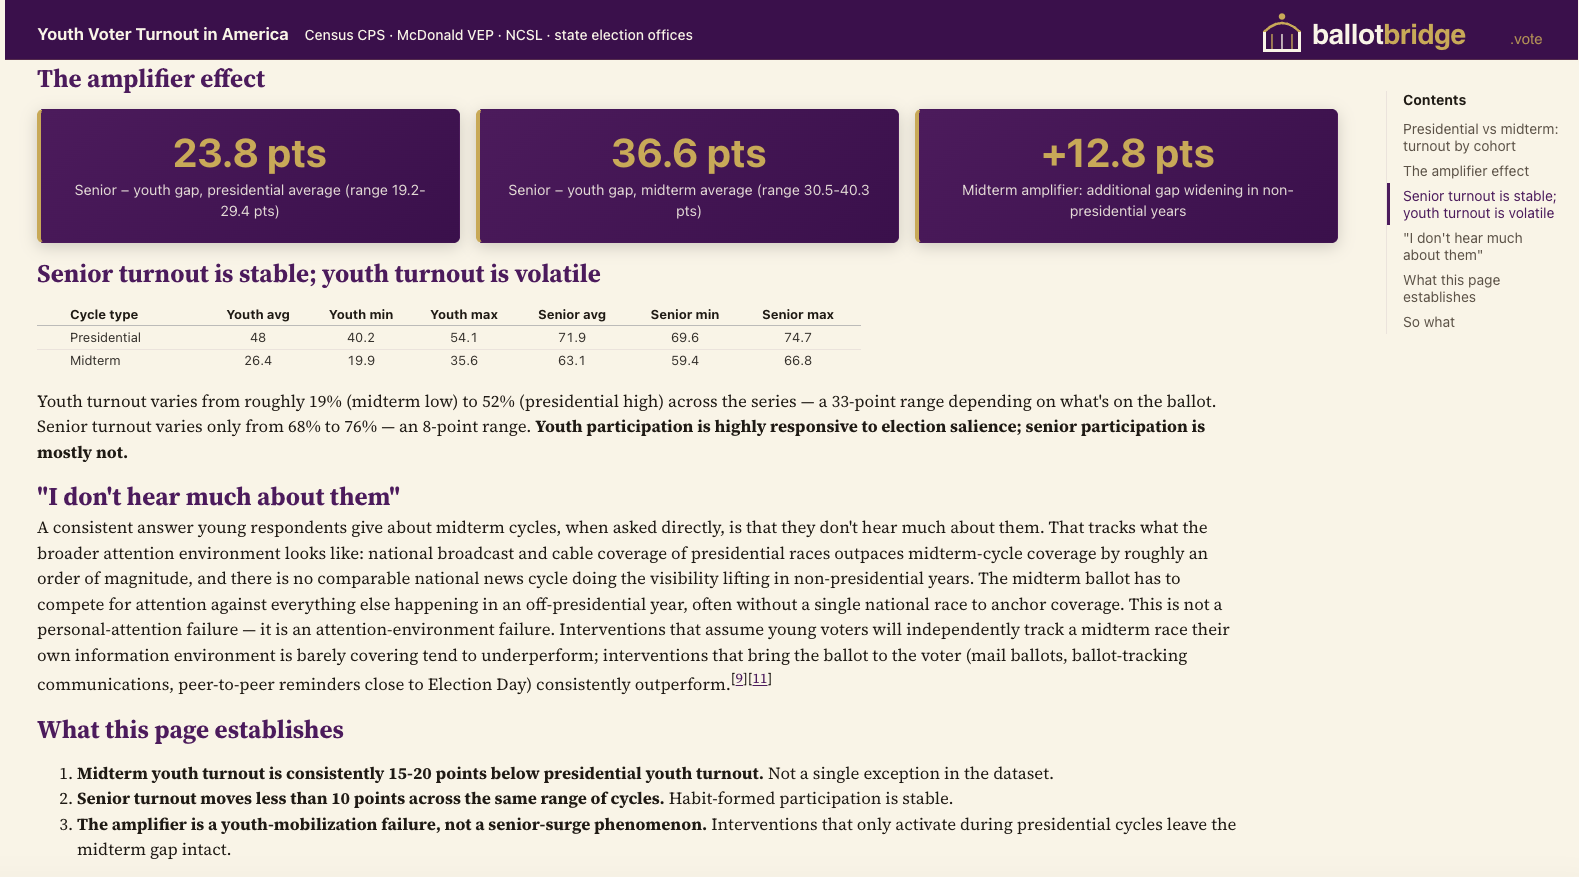
senior–youth gap, presidential average
0
senior–youth gap, midterm average
0
the midterm penalty — extra gap in non-presidential years
Presidential vs midterm turnout by cohort. Seniors hold steady; youth collapse. "I don't hear much about them."
A midterm is the election in the middle — no president on the ballot, just Congress, your governor, your mayor, your school board. Those are exactly the races young people skip. So in presidential years the gap between young and old runs about twenty-four points; in midterms it nearly doubles, to thirty-seven. Here's the part that rewrites the story: older voters barely move between the two. It's young people who vanish — and the men the system already loses go first. Which means the people deciding your rent, your schools, and your policing get chosen mostly by the oldest voters in the room.
The facts — why it's not apathy · Finding 3 · layer one
Layer one: the system never caught them.
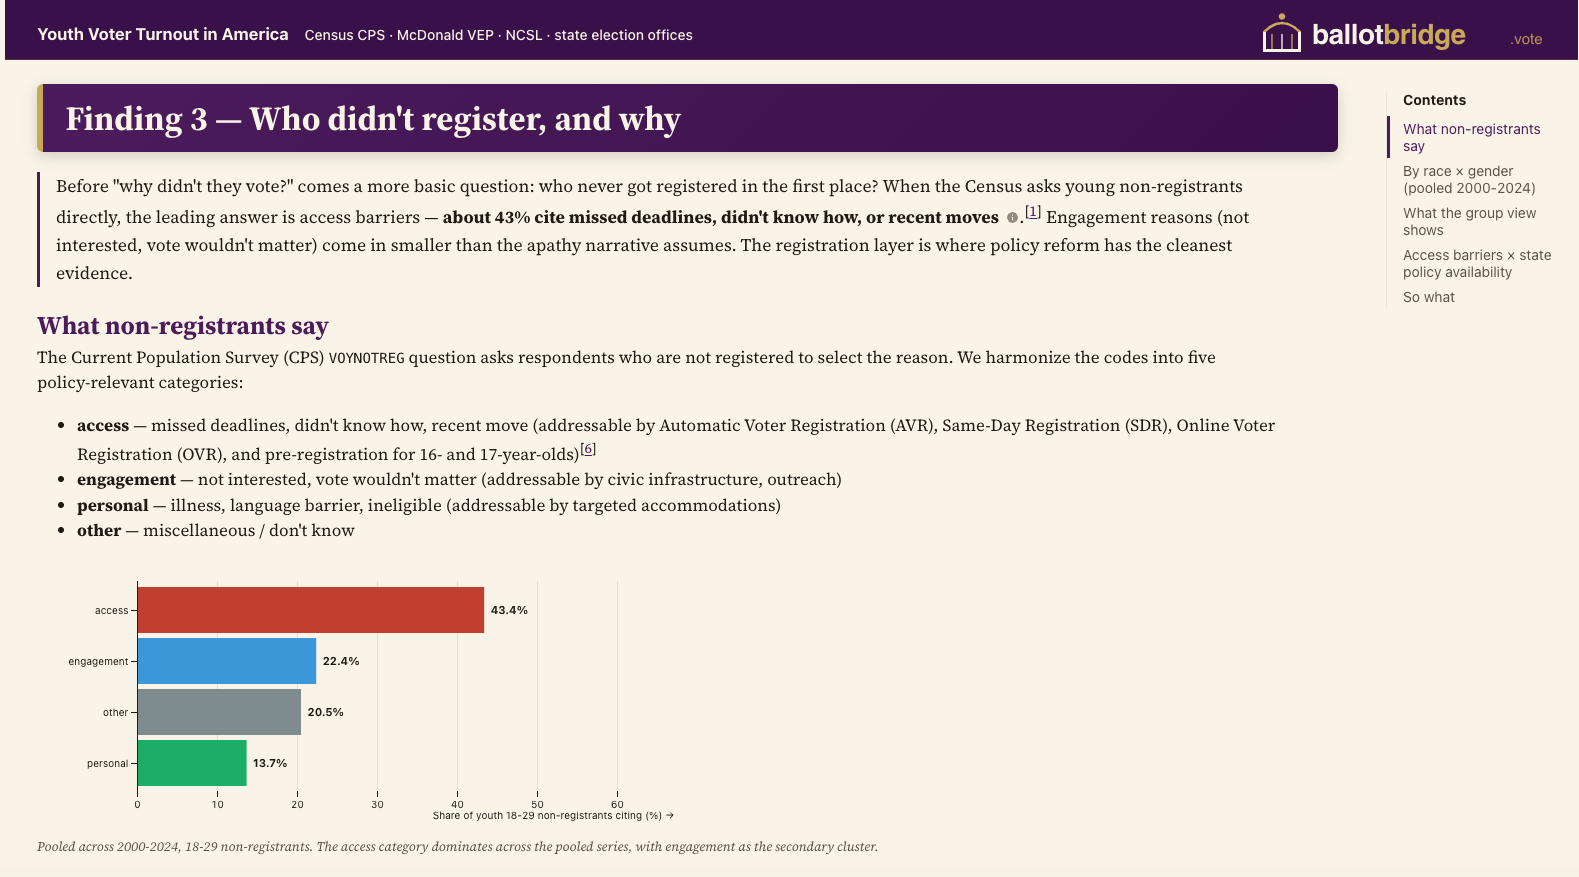
Before anyone votes, they have to register. So the Census asks young people who never registered: what stopped you? The bar chart below shows their answers, grouped into four categories. The top bar — 43% — covers what we call access barriers: missed the deadline, didn't know how, moved recently. Only about 22% say they weren't interested. The story most people tell about young voters is "they don't care." Their own answers tell us the opposite — most never got the chance.
0
cite an access barrier (deadline, process, recent move)
0
cite not interested — the "apathy" narrative, in their own words
Why young non-registrants didn't register, pooled 2000–2024. The top bar (access barriers) is nearly twice the engagement bar.
Before anyone votes, they have to register. So the Census asks young people who never registered a simple question: what stopped you? Look at the chart. The longest bar — forty-three percent — covers what we group as system-friction reasons. Three things bundled together: they missed the registration deadline, they didn't know how to register, or they moved and the rolls didn't follow them. Three different problems, three different fixes — automatic registration handles the first, civic education the second, online portability the third. About twenty-two percent said they weren't interested — a real share we should take seriously. But twice as many cite the structural reasons. The story most people tell about young voters is "they don't care." Their own answers tell us the opposite. Most never got the chance.
The facts · Finding 4 · the Second Mile
Layer two: registered — and still didn't finish.
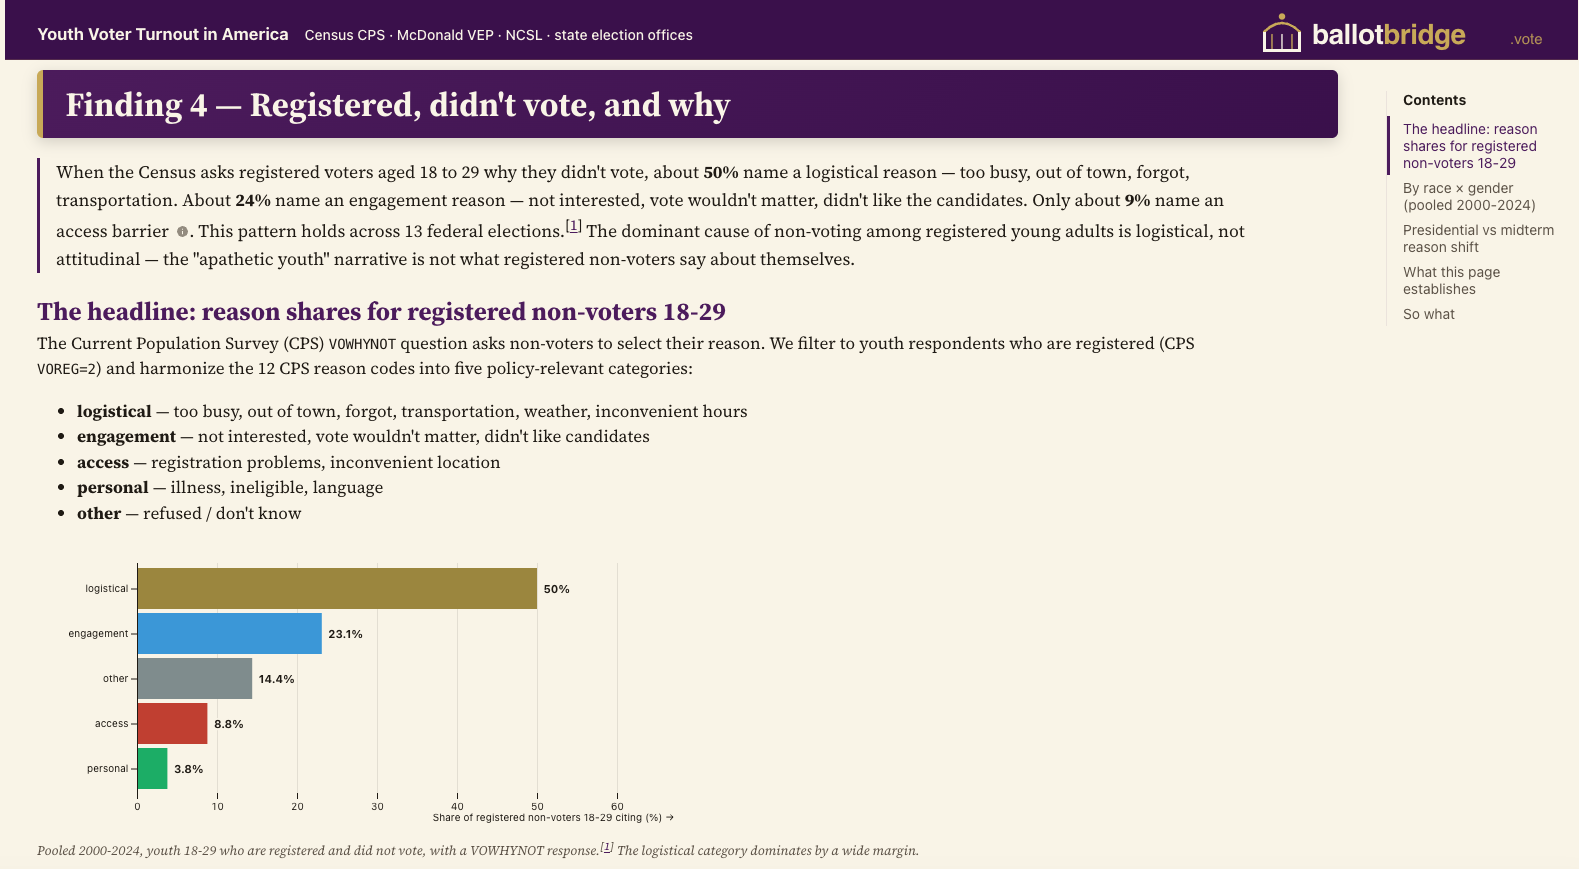
Of registered young people who didn't vote, about half give a logistical reason — too busy, out of town, forgot, couldn't get there. Only 9% name access; only ~23% anything like disinterest. The dominant cause is logistical, not attitudinal.
0
logistical
0
engagement
0
access
Read this as a system failure, not a character flaw. Every cycle, the process loses about 1 in 3 registered young Black and Hispanic men aged 18–32 — and nearly 1 in 2 in midterms — at the very last step. The survey is blunt about why: it's logistics, not desire. Clear the path, and they show up.
The Second Mile in one chart: 50% logistical · 23% engagement · 9% access.
This is the heart of it. These are people who did everything right — they registered. Then Election Day came and life got in the way: work ran long, they'd moved and the address was stale, there was no ride, they didn't know the hours. When you ask them why they didn't vote, about half name a logistics reason — too busy, out of town, couldn't get there. Only about one in eleven names anything to do with access, and only a quarter anything like not caring. The will was there. The last mile was never built for them — and it lands hardest on young Black and Hispanic men: about one in three every federal election, and nearly one in two in the midterms.
The gaps — where the lever is · Finding 5
Give them the option, and they take it.
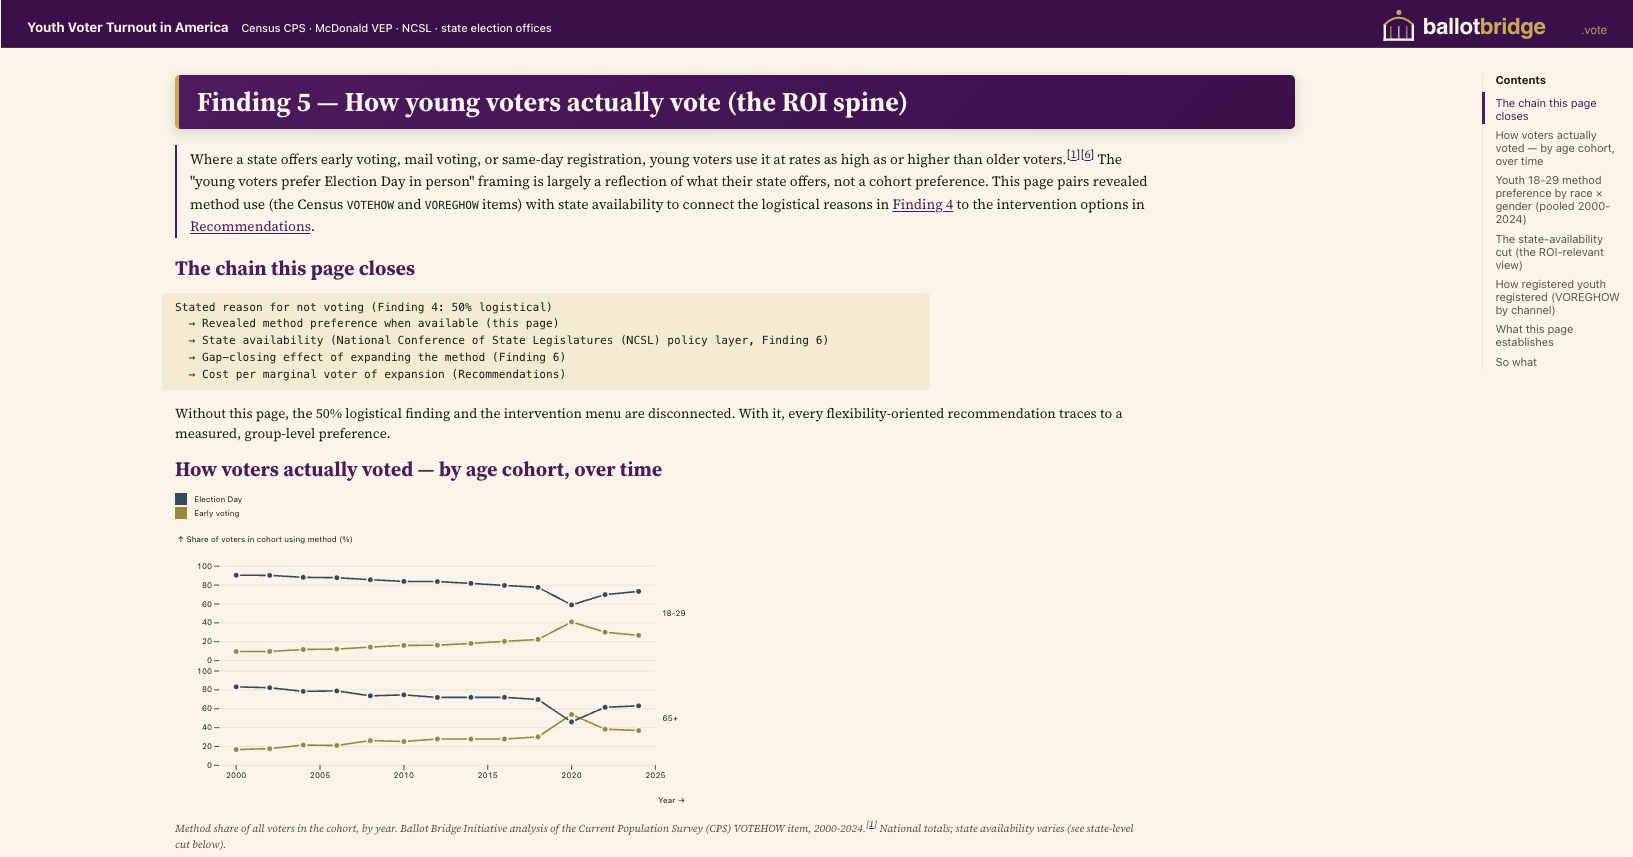
Where a state offers early, mail, or same-day voting, young voters use it — as much as or more than older voters. "Young people prefer Election Day in person" is mostly a description of what their state offers, not a preference.
Method use by cohort over time — the "ROI spine" linking logistics → policy → measured effect.
Here's the proof it's about hassle, not heart. In states that offer early voting, mail voting, or same-day registration, young people use those options just as much as older people — sometimes more. The idea that young folks simply "prefer" showing up in person on a Tuesday is mostly a story about what their state happens to offer them. Give them a door that's actually open, and they walk through it.
The gaps · Finding 6 · the lever
Six policies. One score. The gap moves with it.
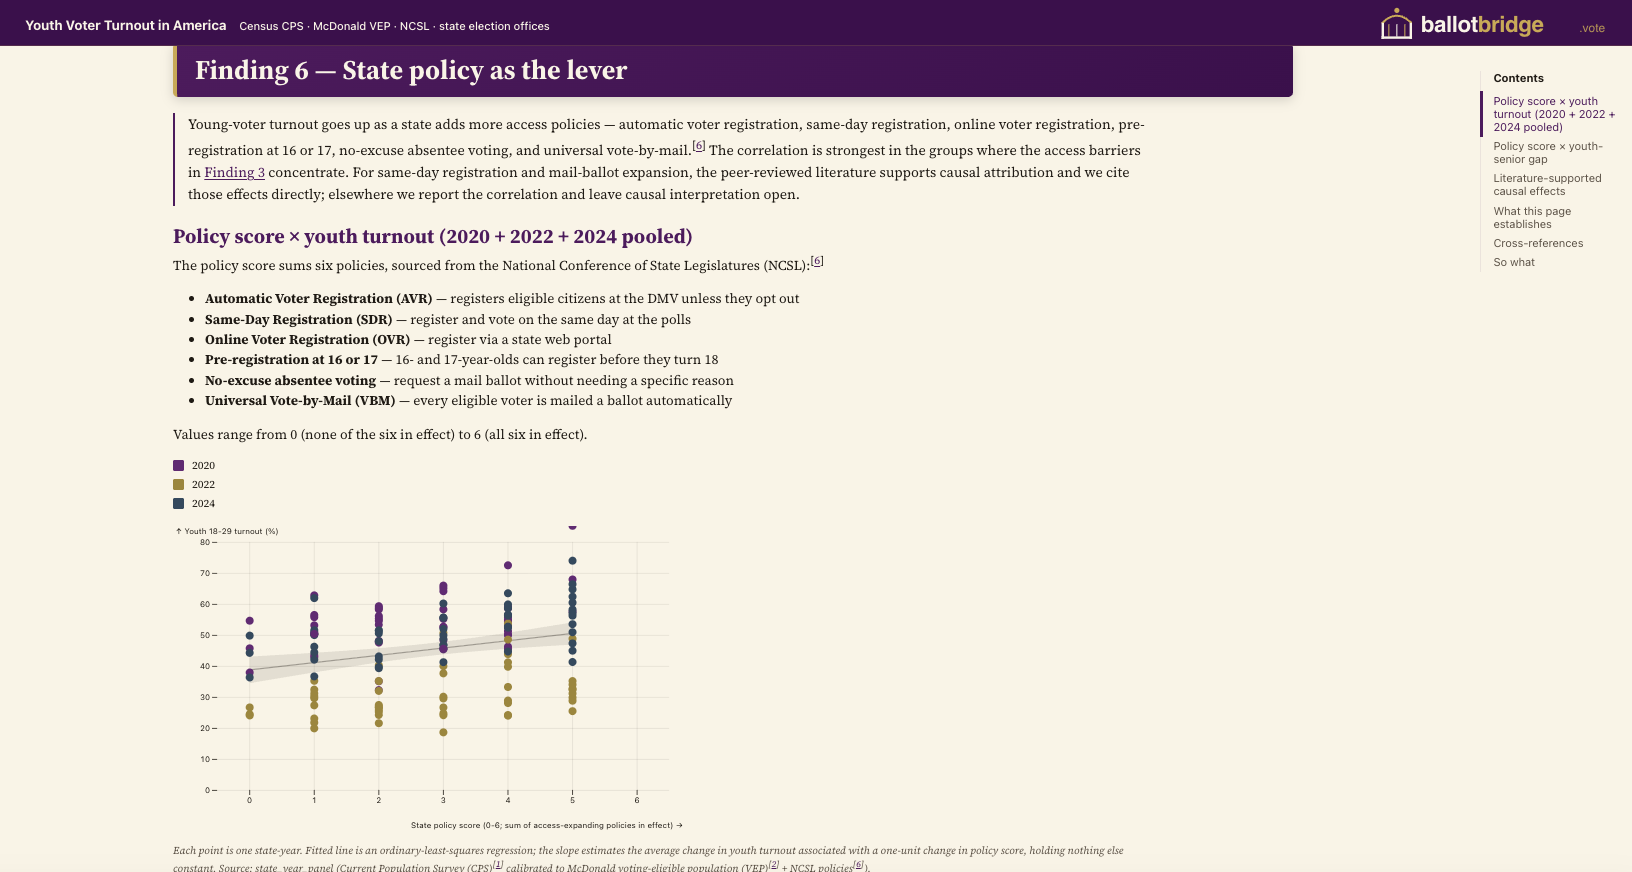
Sum six access policies into a 0–6 score — AVR, same-day registration, online registration, pre-registration at 16/17, no-excuse absentee, universal vote-by-mail — and youth turnout climbs as the score climbs, steepest where barriers concentrate. The levers are real: Secretaries of State and legislators can move all six.
Average youth 18–29 turnout by state access-policy score (0–6), 2020 + 2022 + 2024 pooled.
So where's the lever? It's state law. Take six simple policies — automatic registration, same-day registration, online registration, pre-registration for teens, no-excuse mail voting, and vote-by-mail — and score each state from zero to six. The relationship between that score and the youth-senior turnout gap is correlational, not causal — states with different policy mixes also differ in demographics, urbanization, and election administration. But the slope is consistent across thirteen elections: states with the highest scores show a gap four to seven points smaller, on average, than states with the lowest. The good news: none of these are acts of Congress. A Secretary of State, a state legislature, an election board can switch on every one — which is why this is where change actually happens.
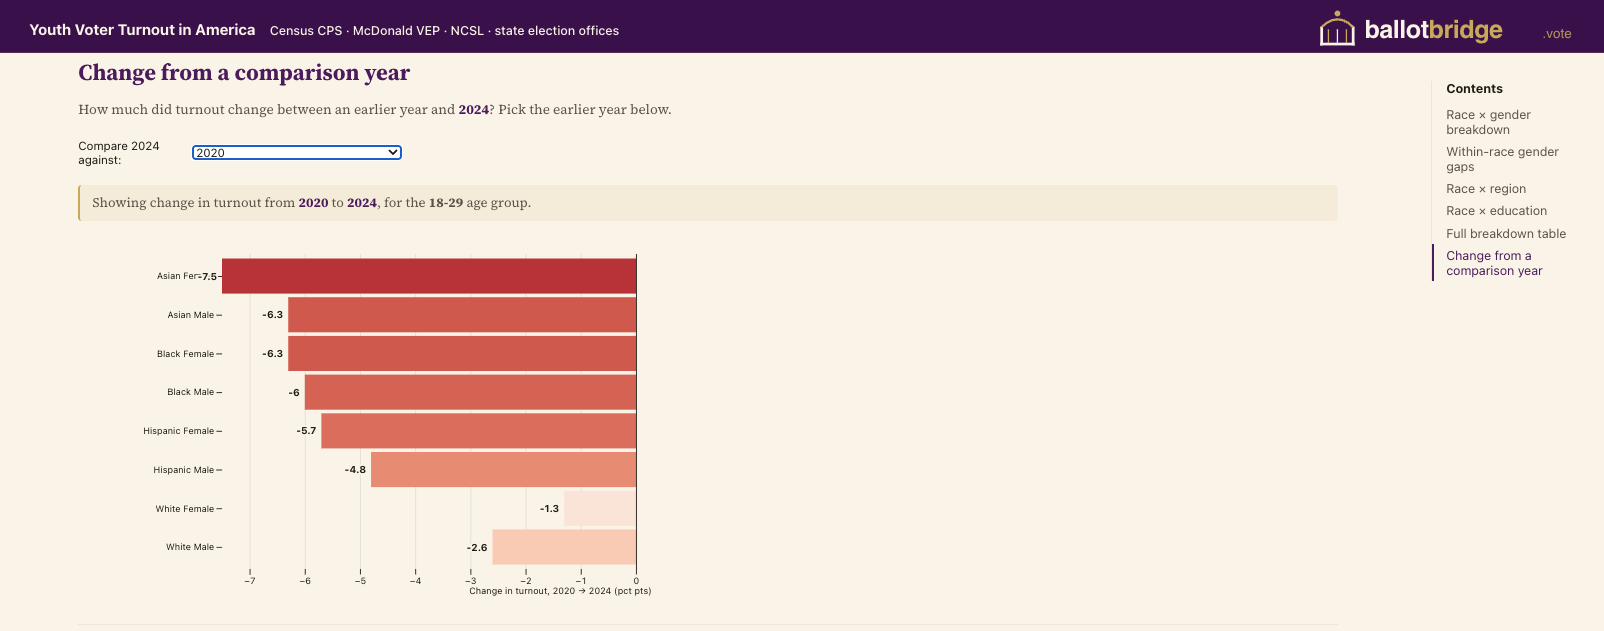
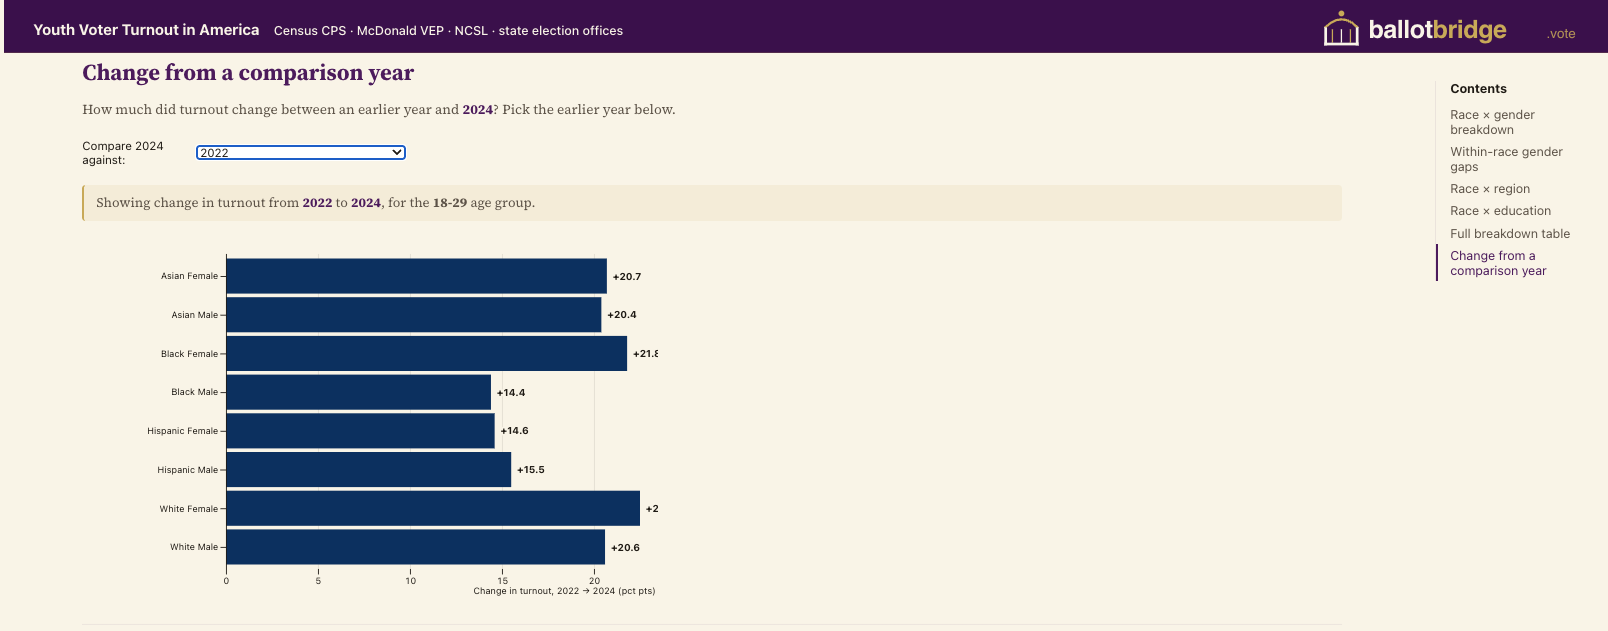
Who it's really about · race × gender
This is the group, in the data.
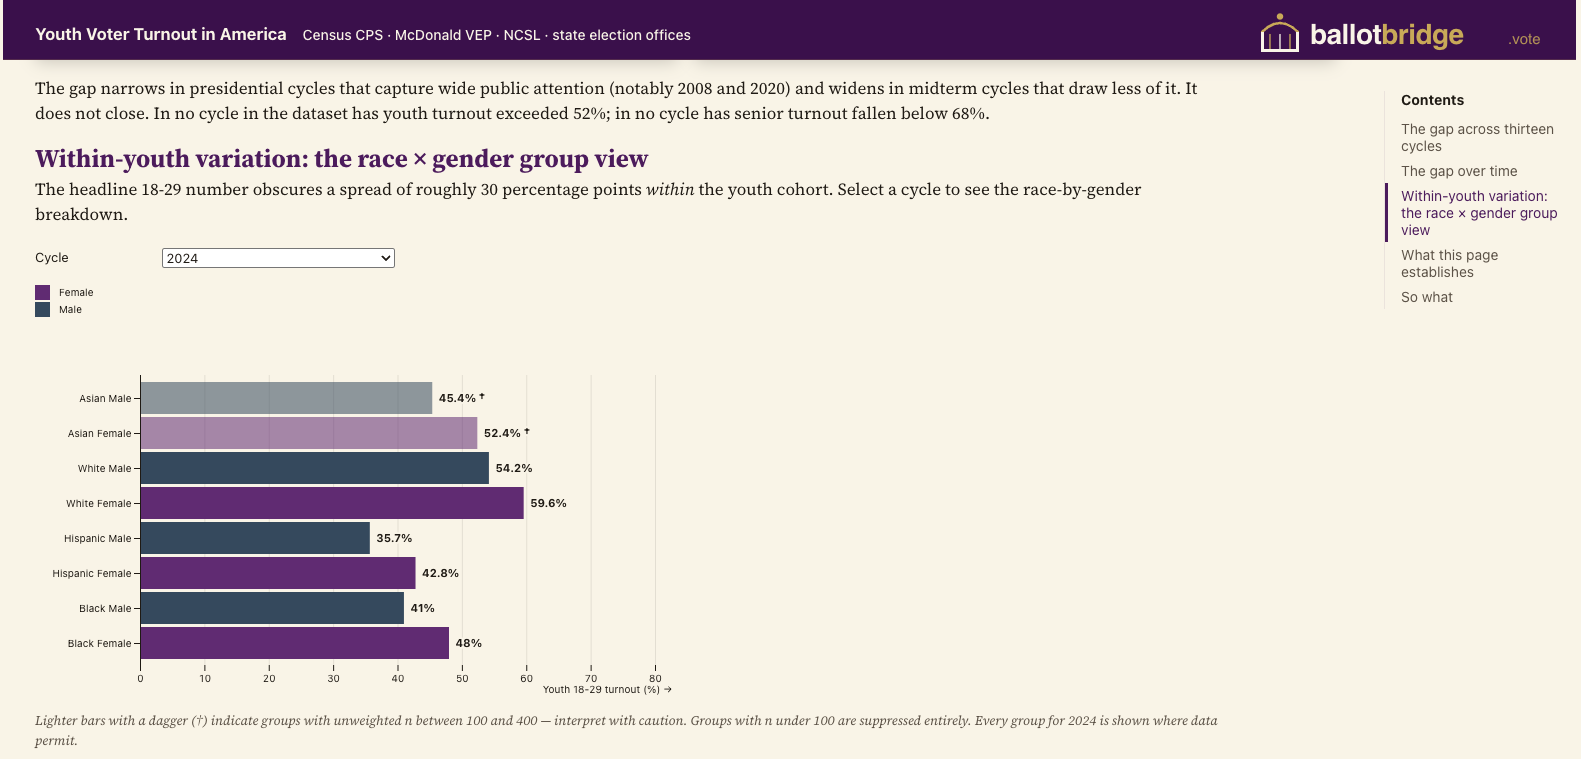
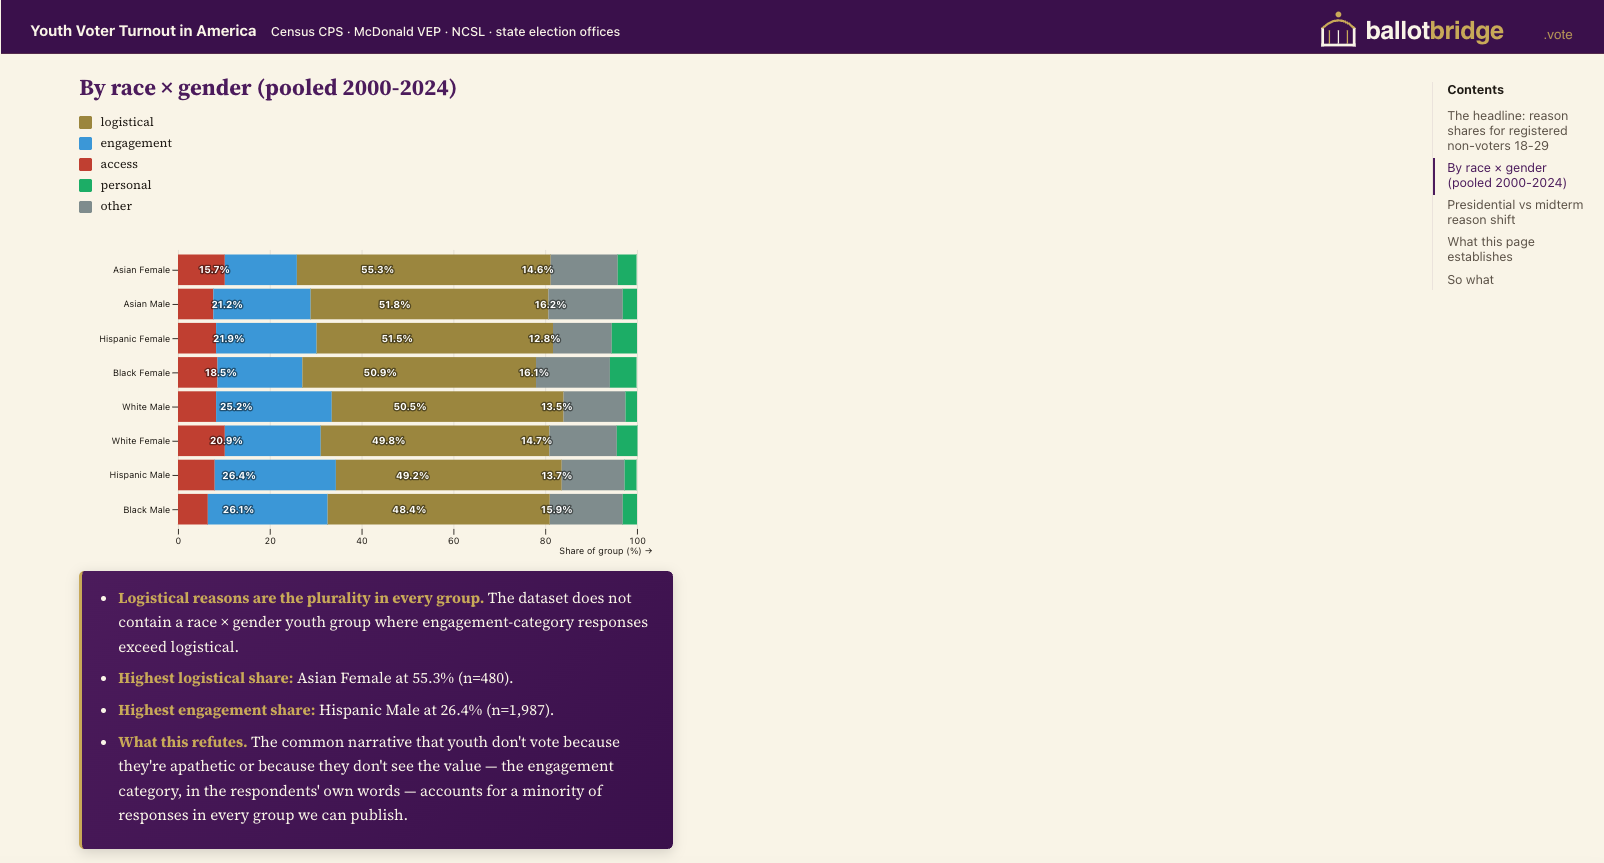
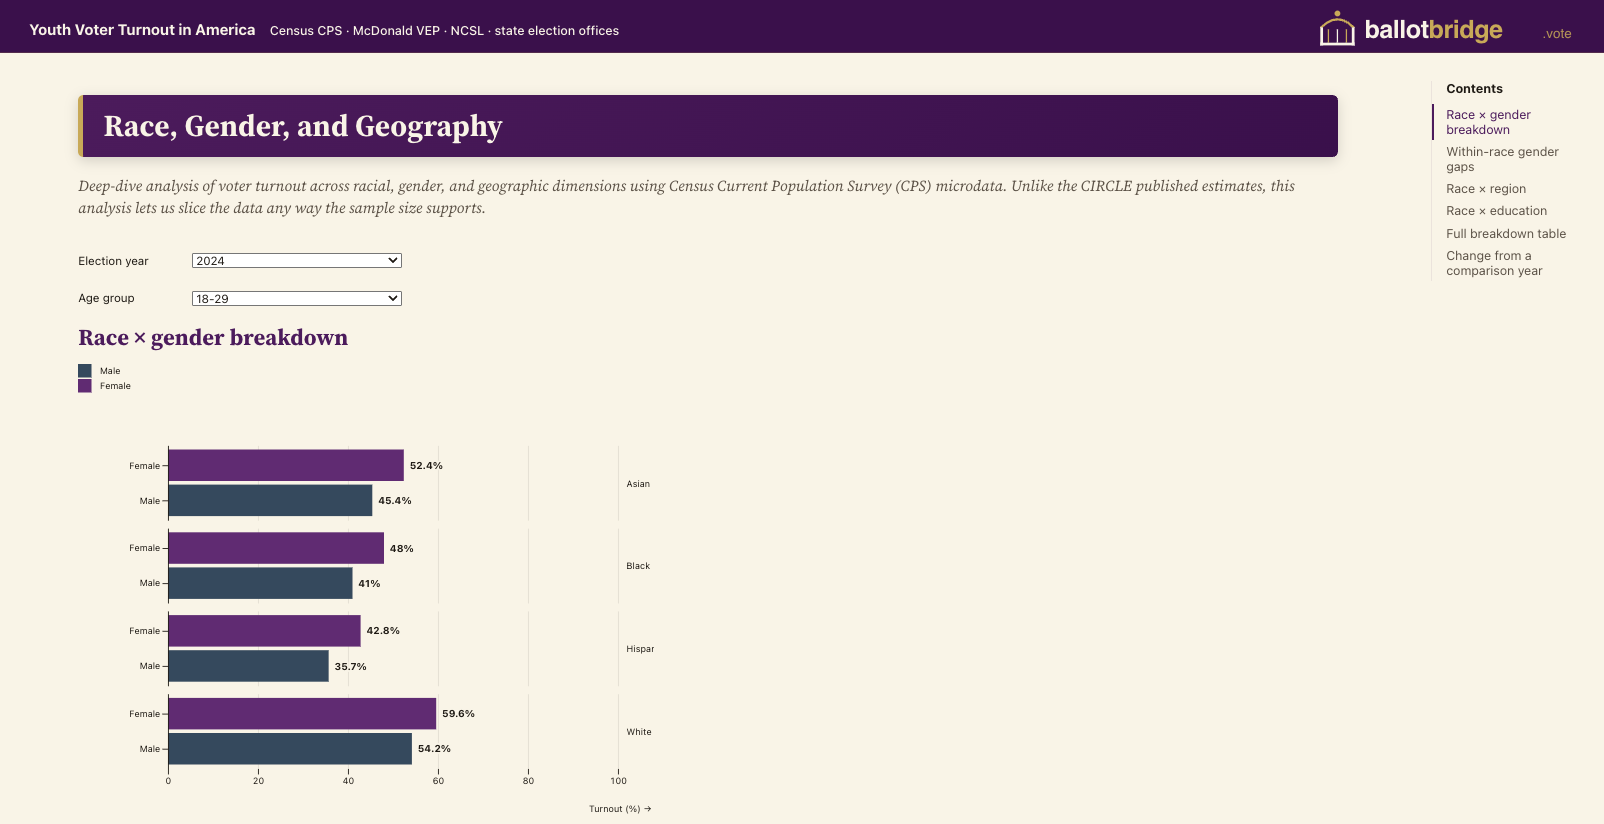
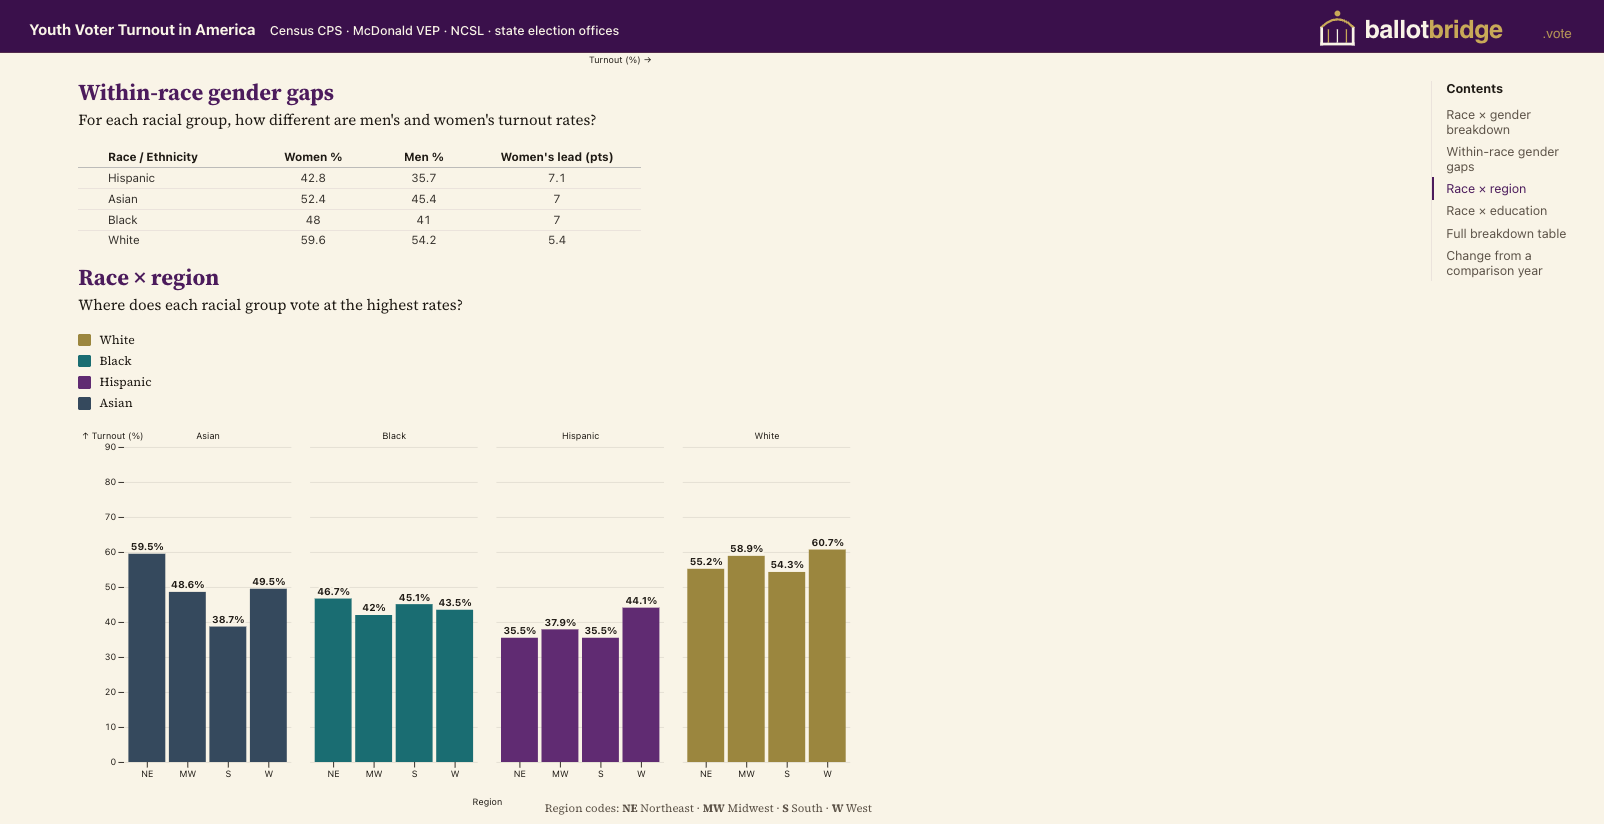
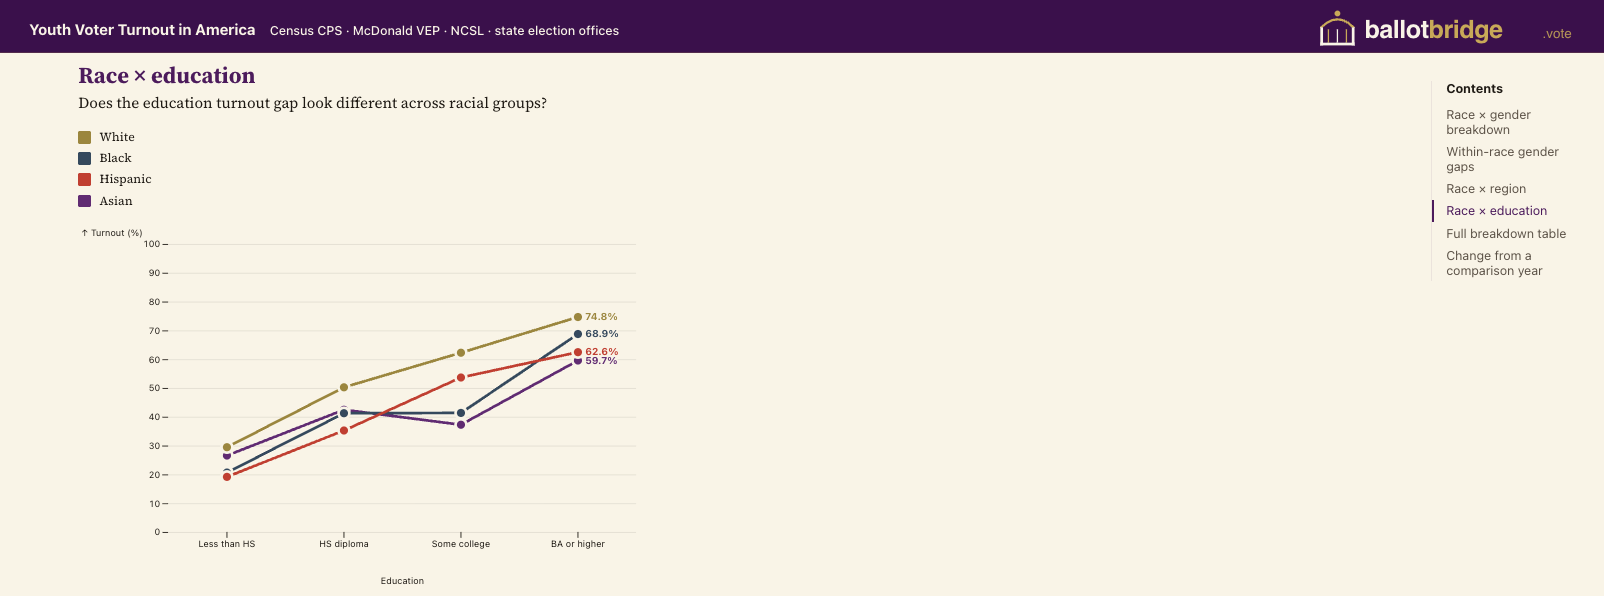
Slice the same data by race and gender and one group sits at the sharp end of every number: young Black and Hispanic men — exactly where the registration bottleneck and the logistics wall overlap. Fix the system there, and the whole curve moves.
Turnout by race × gender. The deep-dive the published estimates can't show.
Slice the very same data by race and gender, and the gap stops being abstract — it gets a face. Asian and white turnout sits near the top. Black and Hispanic men, eighteen to thirty-two, sit at the bottom of nearly every cut. Survey data — Census supplements and ANES — consistently shows these voters say their vote matters and that elections are worth participating in. Trust in institutions is more mixed; we don't paper over that. But the desire to participate is there. They're standing exactly where the registration bottleneck and the logistics wall overlap. The civic organizations working this cohort — NPHC chapters, Mi Familia Vota, Black Voters Matter Fund, and others — have been carrying this work without the infrastructure to scale it. Fix the system right there, with them, and the whole curve lifts.
The solution · precision-built for this group
Finish the mile the movement started.
Twenty years of organizing got Black and Hispanic men onto the rolls. These three pieces build what comes next — aimed squarely at men 18–32, each closing one failure, and reinforcing each other: First ID feeds the Concierge, the Concierge feeds the data, the data feeds the movement that did the registering.
1
Ages 18–20
First ID, First Vote
Get your first state ID at the DMV and register to vote in the same 60 seconds — an opt-in DMV-to-rolls integration.
▶ Closes the registration layer
$25k–$75k / state · 4–6 weeks · Secretaries of State, EAC grants
2
Ages 21–32
Ballot Concierge
A free app — English and Spanish at launch, more languages by 2027 — that walks a registered voter from "am I registered?" to "my ballot was counted" — reminders, preview, tracking, rides.
▶ Closes the Second Mile
$50k–$200k / state · 3–5 pt lift target · foundation-funded
3
Movement infrastructure
Civic Org OS
Shared platform so the nonprofits already doing the work can target, coordinate, pay organizers, and measure lift — free for 501(c)(3)s.
▶ Closes the coordination gap
$1–3M build · free, indefinitely · foundation infrastructure grants
Already doing the work? You're the bridge.
Civic Org OS isn't a new gatekeeper — it's free, co-branded infrastructure for the people already on the ground: NPHC / Divine Nine chapters, the NAACP, Voto Latino, Mi Familia Vota, Black Voters Matter, When We All Vote. Bring your chapter's registration drive and your turnout data into one place — and keep the credit.
Twenty years of organizing already did the hard part — it got these men registered. So we build what comes next, aimed squarely at Black and Hispanic men eighteen to thirty-two. Package one — First ID, First Vote. An integrated workflow at the state DMV so that when an eighteen-year-old picks up their first state ID, voter registration is offered as a default step in the same transaction. Forty-four states and D.C. offer DMV voter registration today, and twenty-three states and D.C. have made it automatic — but by our count, far fewer integrate it tightly enough with first-ID issuance to capture eighteen-year-olds at the moment they walk in. Ballot Bridge partners with state election offices to close that implementation gap. Package two — Ballot Concierge. A multi-language voter-workflow app, in design now, covering every step from "am I registered?" through "did my ballot count?" Built to be distributed in partnership with the trusted spaces this community already turns to — barbershops, salons, gyms, churches, HBCUs, and Hispanic-serving institutions — and with the civic organizations holding trust in those spaces. Not parachuted in. Co-built. Package three — Civic Org OS. A shared measurement and workflow platform for the Black-led, Latino-led, and community-based nonprofits already doing this work. Foundation-funded so it stays free for mission-aligned 501(c)(3)s — that's the model, not a marketing line. First ID feeds the Concierge, the Concierge feeds the data, the data feeds the movement. A loop that finally closes.
The evidence · recommendations, re-drawn
What works — on one map.
The recommendations matrix is a wall of numbers. Here's its message in one picture: every intervention placed by cost per additional voter against evidence strength. Fund the top-left. The three packages live there.
Positions reflect the matrix's evidence and cost-per-marginal-voter columns (qualitative placement; bubble size ≈ effect). Exact figures + funders: the recommendations matrix on the live site.
Now, what actually works — and what's a waste? Put every option on one map: how many dollars it takes to move one more voter, against how strong the evidence is that it works. "Cost per voter" is exactly what it sounds like — the price tag on one more person actually casting a ballot. The winners are boring and consistent: automatic registration and real, person-to-person organizing — cheap, and proven. The money pit is just as consistent: untargeted online ads, mass texting with no human behind it — expensive, with little evidence they move anyone. Fund the top-left. The three packages live there.
The return · what a dollar buys
A vote for the price of a coffee run.
Nobody talks about the value, so let's. Every dollar here is measurable — and it goes further than the alternatives by a wide margin.
$30–70
to move one more voter — registration automation + peer organizing (cheap, proven)
≈ $0 lift
measurable return on celebrity spots, untargeted ads & broadcast texts — at any price
≈ 1 ad buy
a whole state's Ballot Concierge costs about one TV flight — but moves countable voters
Let's talk value, because nobody else does. Workflow infrastructure costs roughly thirty to seventy dollars per additional voter mobilized — a range drawn from published GOTV meta-analyses, Green and Gerber and successors. That sits in the same neighborhood as door-knocking and relational organizing — the highest-evidence GOTV tactics in the field. General-audience digital persuasion ads, by the best published estimates, deliver a small fraction of that lift per dollar spent. A state's worth of Ballot Concierge runs about fifty to two hundred thousand dollars — roughly a single television ad flight — and unlike the ad, it moves voters you can count: a three-to-five point lift target among the very people the system was losing. Then there's the multiplier: the nonpartisan groups doing this work run on fifty to two hundred thousand dollars a year, while campaigns spend billions. Hand them shared infrastructure, and every one of their dollars reaches further. The numbers are illustrative — meta-analytic ranges, not promises. Workflow infrastructure isn't a replacement for field organizing. It's the missing layer underneath it.
Cost-per-voter ranges are illustrative — drawn from the recommendations matrix's per-marginal-voter column and published get-out-the-vote cost figures; package costs are from the solution spec ($25k–$200k per state). Exact figures on the live site.
The close
One last step. Let's build it.
These men are registered and ready — they've told us exactly what's in the way. The fixes are cheap, tested, and sitting in front of the people with the power to pass them. All that's left is to finish the mile.
Bring one question to your next conversation about this work.
And if you're a young voter: take the Midterm Matters survey — five minutes, eleven questions. Your answer is the data.
One group, one last step. Black and Hispanic men eighteen to thirty-two are registered and ready — they've already told us, in their own words, what stands between them and a counted ballot. The fixes are cheap, they're tested, and they sit in front of the people who can pass them. If you're a foundation officer, a Secretary of State, or a leader of a community-based civic organization — especially the Black-led, Latino-led, and Divine-Nine-affiliated groups already doing this work — there's a contact link on this page. Start a conversation. We're not here to replace anyone. We're here to measure what works and put the tooling under it. Over a century of civic work — the Divine Nine voter drives since the nineteen-twenties, the Voting Rights Act, decades of registration organizing — got them on the rolls. The second mile is where the next chapter gets written. Let's help them finish.
Ballot Bridge Initiative · nonpartisan · open-source · sources: Census Current Population Survey, McDonald VEP, NCSL, state election offices.
Framing: competitiveness-and-governance language only.